Dendrometric measurements

Mesure du DBH

How much CO2 does a forest absorb per year in the project area? This is the key question that all reforestation projects must answer in order to obtain certification and attract donors.

The simplest solution is to rely on scientific studies that have measured biomass growth in similar forests. The problem: very few articles on African forests have been published on this subject. Fortunately, the Hérault et al. research team has quantified the growth of several of our project’s tree species in the Korhogo region of Côte d’Ivoire, 400km from our project, over 30 years (The long-term performance of 35 tree species of sudanian West Africa in pure and mixed plantings).

Another, more precise approach is to measure the biomass of mature forests in the project area, and then deduce annual growth. This is what we have done with our partner EcoAct.

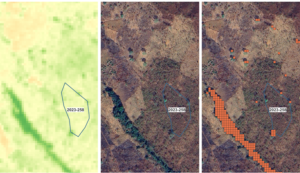
Before we can begin, we need to accurately identify the age of the forests to be measured. The objective is to know the average biomass growth per year and per hectare. To do this, EcoAct identified all the 20-year-old forests and all the 10-year-old forests in the Samana sub-prefecture. We then applied a number of additional selection criteria to obtain forests with little degradation and easy access.

sélection des forêts

Thanks to this pre-selection, we were able to identify the GPS points of 5 forests of 10 years and 5 forests of 20 years (knowing that we would only have time to measure four of each category).

On site, it’s not advisable to go into a forest alone, especially if you’re a foreigner. It is more respectful and prudent to make yourself known to the authorities in the nearest village, to explain your intention, receive advice and be accompanied. These discussions can be time-consuming, as there are also many questions about the project, but it’s well worth the effort. The support of the village is crucial.

Then it’s off to the forest. This often requires long approach walks, either in the bush or in the forest. The machete is essential for progress, and it’s best not to have forgotten anything in the vehicle (measuring equipment, raincoat, boots, water, etc.).

Once the GPS point had been reached, we marked out a 30m x 30m perimeter in each forest with tape, so that we knew exactly which trees to include in the measurements and which to exclude because they were outside the 900 m2 perimeter.

We then proceed methodically to make sure we don’t miss any trees. Specifically, one person measures the diameter at breast height, one person measures the height, one person indicates the species and marks the tree, to avoid re-measuring it a second time, and one person records this information. To recognize species, we need to rely on local expertise.

dendrométrie

In the end, we measured over 1,500 trees in six days on 13 plots of land (in addition to the 4 10- and 20-year-old forests, we also measured trees on land to be reforested by arboRise in 2021 and 2022). It’s tedious work and not without risks, sometimes in the rain and in overgrown vegetation, but it’s essential work that will enable us to accurately calculate the biomass, and therefore the carbon, and therefore the potential income from the project, and therefore the possible expenditure.

Thank you Stéphane, thank you Julia for your strong engagement in the field under difficult conditions

This initial overview of the forests has given us some tentative indications:

  • Species diversity depends on the soil: some 20-year-old forests were almost monospecific, with Uapaca Somon dominating, like beech in temperate forests, at the expense of all other species. This should encourage us to carry out targeted thinning to maintain biodiversity.
  • On the sites reforested in 2021 and 2022, there is great variability in terms of density: it can reach more than 4,500 stems per hectare, but some parts of the plots are still bare 2 years after seeding. This is due to the soil.
  • The same 10-15 pioneer species are almost always found, and we can assume that natural regeneration is effective. This should encourage us to focus seed collection on the rare species on our list of 40 species.

Once the data has been collected, the analysis work can begin. Silviculturists and forestry specialists long ago learned how to estimate the volume of a log (a delimbed trunk) when Europe was being deforested to build ships. Basically, it’s a matter of calculating the volume of a cylinder: Pi x radius2 x height. In reality, a trunk is not really cylindrical, but rather conical. And the proportions between diameter and height vary depending on the type of forest (temperate, tropical, boreal, dry, humid, rainforest, etc.). This is why numerous studies have attempted to find the allometric equation that most closely approximates a given forest type. Some even try to include branch volume in the equation. It should be remembered that these equations are fairly reliable for monospecific cash tree plantations, but in natural forests made up of several species this quickly becomes approximate and generally underestimates the forest’s biomass volume.

With our partner EcoAct (thanks Margarita! ), we tested seven allometric equations, specific to tropical forests, and selected the equation whose correlation with the NDVI value of the GPS point was maximum: the equation of Djomo et al. (2010)* which considers diameter and wood density (as we couldn’t measure the height of all trees): B = exp(-1,8623 + 2,4023 ln(D) – 0,3414 ln(p))

* Adrien N. Djomo, Adamou Ibrahima, Joachim Saborowski, Gode Gravenhorst: Allometric equations for biomass estimations in Cameroon and pan moist tropical equations including biomass data from Africa, Forest Ecology and Management 260 (2010) 1873–1885, 2010

équations allométriques

These values indicate the weight of dry biomass. Then remove the weight of all non-carbon atoms (x 0.47), and add the weight of the two oxygen atoms (x 3.67) to obtain the weight of CO2 in the trunks of each hectare. To this, by convention, we add 20% to account for subterranean CO2, present in the roots.

We can thus say that, in the project area, the trees of a forest have absorbed 325 tonnes of CO2 per hectare after 20 years, i.e. 16 tonnes per year.

Since we have values for forests of 2, 3, 10 and 20 years, we can even estimate the growth curve:

courbe de croissance de la biomasse

It should be remembered that we’re dealing here with naturally regenerating forests, some of which have probably been degraded (for example, the biomass of one of the 10-year-old forests is significantly lower than that of the others). However, our garden forest approach should generate more diversified, denser and less degraded stands, with a greater quantity of biomass as a result.

We’ll talk more about this in a few years’ time, when we take the first dendrometric measurements of our forests. And in this regard, perhaps some of you can help us find Terrestrial Laser Scanning equipment, which will enable us to measure exactly the whole of a tree (not just the diameter at chest height and the height), so that we can include the CO2 absorbed by the branches, without going through an allometric equation. Thanks for your help !

Terrestrial Laser Scanning


Collaboration with the EPFL

I

Which natural and anthropogenic factors influence tree growth on land reforested by arboRise? To find out, we were lucky enough to have our research project selected by EPFL as part of the Design Projects course. In this compulsory course, master’s students in the ENAC department are responsible for providing scientific answers to problems posed by companies, local authorities and others. This applied research represents around 500 hours of work for each pair, so it’s a real scientific analysis, supervised by EPFL professors.

Ines and Aurèle were immediately interested in our project, and we were lucky enough to benefit from their expertise for several months (around 2 days a week for 15 weeks). Thank you Ines, thank you Aurèle! Both are geoscientists, so they know all the tools of satellite analysis inside out. They were supervised by Professor Devis Tuia. Ines and Aurèle’s report is a mine of information. It can be consulted in detail here: 240607_EPFL Design Project – Final Report.

First, they had to divide the land we reforested from 2021 to 2023 into several categories (basically “good” and “bad” land) based on biomass growth since the seeding date and compared to reference “neutral” land. The data comes from the Sentinel 2 satellite, which arboRise has frequently used for its own analyses. Our two researchers chose to focus the analyses on the month of February (2021, 2022, 2023, 2024), at the height of the dry season, to avoid as far as possible the influence of herbaceous plants on the data.

In a second stage, the baseline (the trees present on the land prior to reforestation) was removed from the data, again to avoid any external influence on the project.

arbres matures

Thirdly, a large number of other data – all potential anthropogenic or natural influencing factors – were collected via various satellites: slope, exposure, altitude, soil type, distance to the nearest village, roads, watercourses, bush fires, etc. The correlations between these potential influencing factors enable us to formulate numerous hypotheses and gain a better understanding of our perimeter’s geography. Correlations between these potential influencing factors allow us to formulate numerous hypotheses and better understand the geography of our perimeter. For example:

  • There is a correlation between longitude (West-East) and altitude, and this is normal: the Simandou chain of hills that borders our perimeter to the West is higher than the bed of the Dion River that borders our region to the East, so our region “leans” towards the East.
  • The average slope of our land is therefore logically steeper to the west, close to the Simandou, which is more rugged. It’s therefore normal that the distance between our plots is greater there than in the flatter areas to the east, where it’s easy to group plots together. Logically, roads tend to lie to the east, so the proximity of our lots to roads is greater to the east of the perimeter.
  • We can also see that the nature of the soil changes according to altitude: soils are more clayey in the West and sandier in the East, since runoff flows from West to East.
  • There are also strong, logical correlations between all the factors linked to soil type: nitrogen and organic carbon levels, soil ph, size of fractions and so on.

corrélations

Finally, fourthly, Aurele and Ines statistically measured the degree of influence of each factor on the growth of terrain categories (e.g.: do all “good” terrains rise in altitude more than all “bad” terrains?). Here, only statistically significant influences are presented:

  • First, there’s the influence of soil type. Sandy soils with a ph close to neutral are more conducive to growth. Surprisingly, we would have expected soils richer in clay, which retain water better, to be more favorable. Also surprising is the fact that nitrogen and organic carbon richness tend to be found in “bad” soils, even though these factors generally favor plant growth.
  • Slope clearly has a negative impact on growth, certainly due to rainwater runoff (water stays on the ground for less time, taking nutrients with it), especially on low baseline sites (baseline: the vegetation existing on the site at the time of seeding). This seems logical: vegetation on the site slows down water runoff. It may also be explained by the fact that grazing fires are lit at the bottom of the slopes, which are more likely to climb the slopes than flat terrain.
  • South-facing land is favorable, since the sunlight favors photosynthesis.
  • Proximity to watercourses and fires is negative. Interestingly, only recent fires (2024) have had a visible impact. Fires in 2021, 2022 and 2023 do not stand out as an influencing factor, probably because trees regenerate quickly after being hit by a fire. It is grazing fires in particular (which stimulate the germination of young grass shoots that livestock are fond of), set in the vicinity of watercourses, that sometimes affect reforested land.
  • Interestingly, distance from the nearest village or distance from tracks and paths had no influence on biomass growth.
  • The year of planting also has an impact. This may be due to the arboRise methods, which have been perfected over time, or to the rainfall, which varies from year to year.
  • There seems to be better growth in plots whose seeds are harvested and sown just before the rainy season. Whether this is linked to the species sown in this group or to the wetter period remains unclear.
  • Finally, it seems that young trees grow better where the “baseline” is low. This may be an effect of natural competition: existing vegetation occupies the land, absorbing water and reducing sunlight.

Generally speaking, with the exception of recent fires, it seems that it’s mainly natural factors that influence tree growth. Of course, it is possible to identify villages on whose land trees grow better than in other villages, but this is probably due more to natural factors (soil type, slope, exposure, etc.), as the “unsuitable” villages tend to be located to the west in a hilly area.

These results are therefore very useful in determining the choice of future sites, where slopes should be avoided, especially along watercourses, and land with a lot of existing vegetation should be avoided.

A huge THANK YOU to Aurèle and Ines, who were truly passionate about the subject, and to Devis Tuia, who was kind enough to choose our research project. As with ETHZ, thanks also to EPFL for providing high-quality scientific expertise to organizations such as arboRise.